Agide Tutorial
Agide is the A-A-P GUI IDE.
NOTE: Agide is still in the development phase:
- Only a few things work properly.
- Only Unix, MS-Windows and Mac OS X are supported.
- Contributions are welcome.
Nevertheless, it is useful for a number of tasks, especially debugging with
Vim and gdb.
If you have not installed Agide yet:
read this.
Index:
1. Creating a project
2. Browsing
3. Building and error messages
4. Debugging
1. Creating a project
First thing to do is to start Agide. If it was properly installed this should
work:
agide
Otherwise, try using the full path:
~/aap/Agide/agide.py
Instead of "~/aap" use the path where you ran CVS to obtain Agide (you may
want to make an alias for "agide" to avoid having to type the path every
time).
Creating a new project is done with the File/New Activity/A-A-P project
menu item.
You will get a file selector.
Create a new directory aaptest (or use any name you like).
Enter that directory and type the file name main.aap:
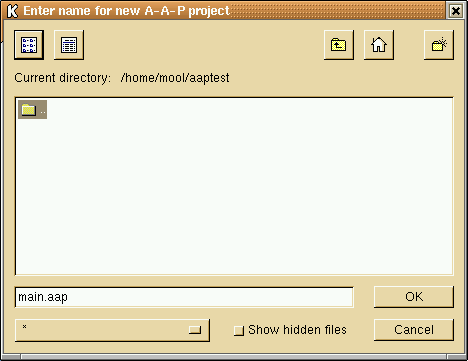
Click OK to create the project.
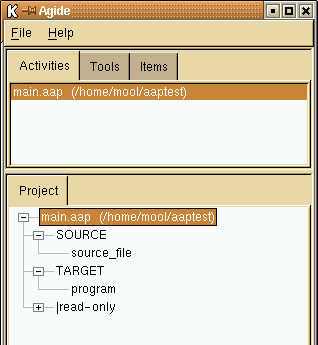
The result is a simplistic project with one source item and one target item.
Click on the + before "SOURCE" and "TARGET" to see what they contain:
You obviously want to change the names.
Left-click in "source_file" to select it.
Wait a second and left-click on "source_file" again (don't do it too fast,
avoid a double-click).
Now you can edit the name.
Use CTRL-U to delete the text and type hello.c, then press
Enter.
Do the same thing on "program" and change it to hello:
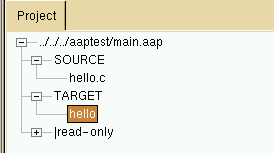
This is the whole project for now.
Save it with the File/Save activity menu item.
Double-click on the "hello.c" source item.
Gvim will be opened on "hello.c", which is a new file.
Enter the C code of your hello program:
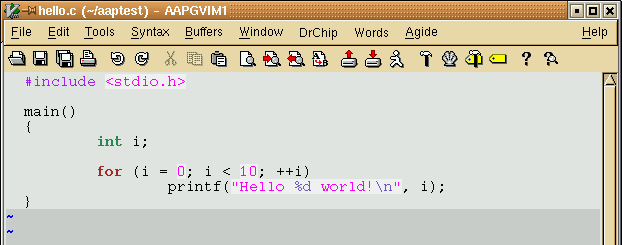
Write the file with ":w<CR>".
Now go back to Agide and point at the "hello" TARGET item.
Right-click the mouse to bring up a popup menu.
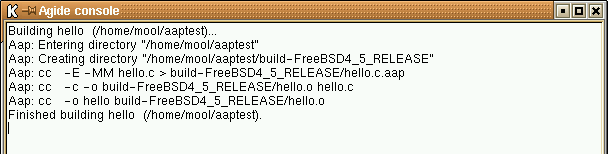
Select the Build item.
A console window will be opened and display the build commands:
Now run your newly compiled program. Again point to the "hello" TARGET item
and right-click the mouse.
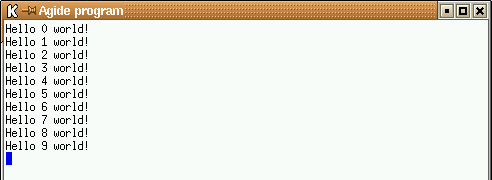
Select Execute from the popup menu.
An xterm window will be opened to run the program in:
To play with the project you can try these:
- Double click on aaptest/main.aap to edit the generated recipe.
- Point to "SOURCE" and in the popup menu use Add file to add another
source file.
- Click on the Items tab in the Agide window. Click on an item to
bring it to the foreground.
top
2. Browsing
First open a file with a nice amount of text.
Use the File/Open activity... menu item.
For the example we will use a help file from Vim.
This text file becomes a new activity.
Note that an activity can be anything you are working on, from one single file
to a huge project.
This gives you the freedom to organise your work.
Right-click on the text file name in the lower part of the Agide window.
From the popup menu select search.
You will see a dialog in which you can enter the text to search for:
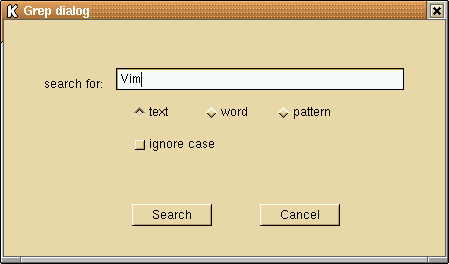
Enter a word like Vim and click on the Search button.
Agide will search the file for matches and present them in a list:
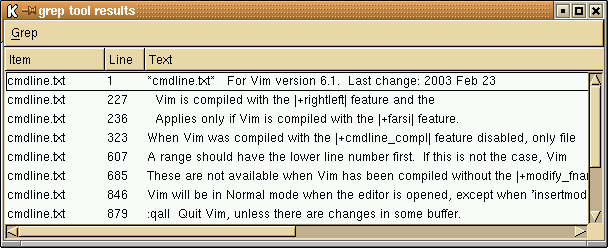
Now double-click on an entry and the position will be displayed in gvim.
To play with the search feature you can try these:
- Try out the different settings in the dialog. For "pattern" Python style
patterns are supported. See the
Python
documentation for an explanation.
- Switch to the project activity you created earlier: in the
Activities tab of the Agide window click on main.aap.
Point to "SOURCE" and in the popup menu use search to search in all
the source files. Add more files first to make this more interesting!
- Click on the Tools tab in the Agide window. Click on one of the
Search tools to jump between lists with search results.
top
3. Building and error messages
Go back to the project we started with: In the Activities tab of the
Agide window click on main.aap.
Double click on hello.c to open the source file in gvim.
Now intentionally create an error: Change "int i" to "int j".
Save the file and start building as explained above.
This will result in an error message:
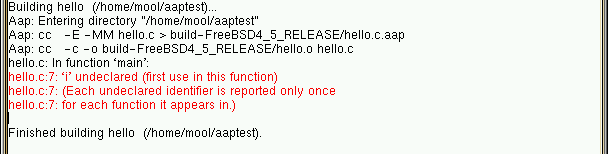
The text of the error is red.
Double click on the red line.
Notice that the cursor in gvim will jump to the location of the error.
Notes:
-
Don't forget to save the file each time before building.
This is not done automatically (yet)!
-
Currently only errors from gcc and Python are recognized.
This is defined in Agide/Console.py for now.
top
4. Debugging
We are first going to build the program for debugging:
-
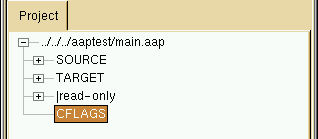
Point with the mouse to the main.aap entry of the Project, in
the lower half of the Agide window.
Right click the mouse and select Add item from the popup menu.
An item "NEW" will appear.
-
Edit the name of this item and change it to CFLAGS:
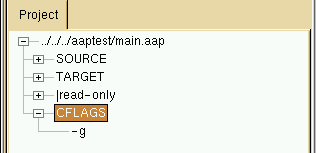
-
Point to the new CFLAGS item, right click the mouse and select Add
value from the popup menu.
An item "NEW" will appear.
-
Edit this item and change it to -g:
-
Build the program by right-clicking on main.aap and selecting
Build from the popup menu.
-
Correct any compilation errors in hello.c and repeat the building until
it succeeds.
Now you are ready to start debugging.
Double click on hello below the TARGET item.
Two windows will open:
-
An xterm in which the debugged program will run.
It's completely empty at this moment.
-
The gdb console.
Here you can type gdb commands and see the results.
After startup gdb displays a few messages here:
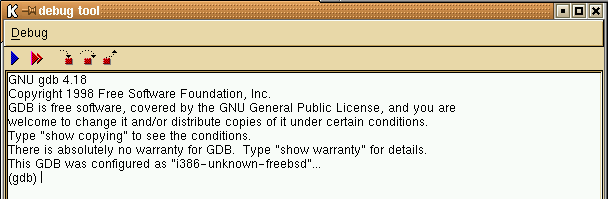
The gdb console has a toolbar.
This is what you can do with the items:

|
Run - start running the program |

|
Cont - continue until the next breakpoint |

|
Step - enter function calls |

|
Next - step over function calls |

|
Finish - continue until the function returns |
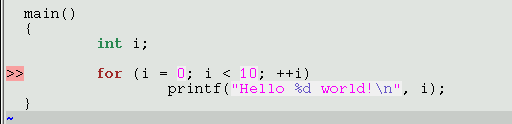
First set a breakpoint.
Go to the gvim window, which should now be displaying hello.c.
Point to the line with "for" and click the right mouse button.
In the popup menu select "Set breakpoint".
The breakpoint is displayed as ">>" to the left of the line:
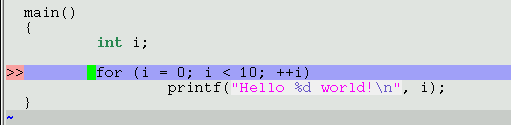
In the GDB console window click on the Run icon
.
The program will start running and stop at the breakpoint.
This is indicated with background highlighting:
Now click on the Next icon
.
to step through the program.
Watch the xterm with the output of the program while stepping through it.
While at a breakpoint you can inspect the value of a variable.
In gvim, point to the "i" variable (any of the five occurrences).
Keep the mouse pointer in the same position for about two seconds.
A small window will pop up to show the value of the variable:
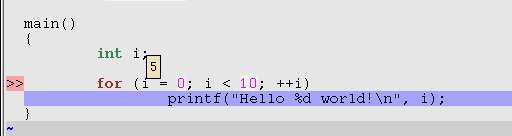
In this image the mouse pointer itself is not visible, it would be just left
of the popup window displaying "5".
That should be enough to get you going. A few more tips:
top
|